For months, I have worked on dynamic debloat of Java artifacts with JDBL. To do so, I need to compile and execute software applications to determine what parts of the compiled application are used when executing it using some workloads. Then, with the collected usage information, I debloat the unused parts of the software. These two main tasks (execution and usage collection) appear straightforward at first glance. However, I realize that the inability of coverage tools to precisely determine what is used at execution time makes this task a real challenge. I found a feasible solution to this problem in the combination of various coverage techniques, i.e., by leveraging software diversity. Let me explain.
The Problem
There are awesome Java coverage tools out there, notably: JaCoCo, JCov, and Cobertura. All these tools rely on a similar underlying principle: determining what parts of the software are necessary to produce the expected result. In general, most Java coverage tools perform the following tasks:
- Instrument the bytecode, i.e., injecting probes at particular locations.
- Execute the test suite to observe which probes are “activated.”
- Determine the section of the original bytecode that is activated.
- Report on the achieved coverage, depending on the chosen metric/s.
During the third task, the coverage tool determines what parts of the application are covered by the tests. For my purposes, it makes sense to consider the rest of the uncovered software parts as bloat. The problem with this approach is that coverage tools are not intended to work for debloating. In other words, their objective is to report only parts that are covered, not all the parts that are necessary. Indeed, there is still a general debate regarding what should be considered as covered or not (e.g., resources, exceptions, interfaces), not to mention the different coverage metrics used out there.
In this context, the richness of Java bytecode constructs and dynamic behaviors poses an additional challenging even for the most advanced coverage tools. Consider this example, reported by a developer in this JaCoCo issue:
1
2
3
4
5
6
7
8
9
10
11
12
13
14
15
16
public class FruitSalad {
    public void mix() {
        yuck();
    }
    public void yuck() {
        throw new IllegalArgumentException();
    }
}

public class FruitSaladTest {
    @Test(expected = IllegalArgumentException.class)
    public void mixItUp() {
        FruitSalad fruitSalad = new FruitSalad();
        fruitSalad.mix();
    }
}
In the code above, the method mix() is not considered as covered by JaCoCo. However, it is clear that, if we remove it, the test mixItUp() will fail. Diving deeper into this issue, one can find the reason for this unexpected behaviour in the JaCoCo documentation: “The probe insertion strategy described so far does not consider implicit exceptions thrown, for example, from invoked methods. If the control flow between two probes is interrupted by an exception not explicitly created with a throw statement all instruction in between are considered as not covered. To mitigate this issue, JaCoCo adds an additional probe between the instructions of two lines whenever the subsequent line contains at least one method invocation. This limits the effect of implicit exceptions from method invocations to single lines of source. However, “The approach only works for class files compiled with debug information (line numbers) and does not
consider implicit exceptions from other instructions than method invocations (e.g., NullPointerException or ArrayIndexOutOfBoundsException)”. In conclusion, JaCoCo does not consider as covered methods with a single-line invocation to other methods that throw exceptions.
Let us consider another example. The following class declares a Java constant using the public final static initializer:
1
2
3
class Foo(){
    public final static int RADIO = 3;
}
The dissasembled bytecode of the class Foo looks as follows:
1
2
3
4
5
6
7
8
9
10
11
12
13
14
15
super public class Foo
    version 51:0
{

public static final Field bar:I = int 3;

public Method "<init>":"()V"
    stack 1 locals 1
{
    aload_0;
    invokespecial   Method java/lang/Object."<init>":"()V";
    return;
}

} // end Class Foo
As we observe, the variable RADIO, initialized with a final static integer literal, is a compile-time constant. Compile-time constants get inlined by the JVM bytecode compiler. This way, if we use it from another class (e.g., by calling Foo.RADIO), then the class Foo will not be considered as used, at the bytecode level. However, if we remove this class, the program will not compile.
There are many more examples like the two described above: including interfaces, annotation, lambda expressions, and implicit constructors. So, it is clear for me the fact that none tool is able to cover all the variety of bytecode constructs coming from real-world Java programs.
The Winning Strategy
To overcome the limitations of coverage and tracing tools, I tackle the problem from a different perspective. I decided to merge the coverage and tracing results of various tools, and debloat what none of the tools determines as covered. The current implementation of JDBL combines the outputs of fourth tools: JaCoco, JCov, yajta, and the native class loader of the JVM. The benefits and drawbacks of these are the following:
- JaCoCo: It is a mature and fine-grain (supports branch-level coverage) Java code coverage tool that relies on ASM for bytecode instrumentation. However, it does not cover throw exceptions, interfaces, and certain bytecode constructs.
- JCov: Is a pure java implementation of a code coverage tool which supports applications on JDK 1.0 and higher.
- Yajta: It is a tracing agent that works offline, it relies on Javassist for bytecode instrumentation. Probes are inserted at the beginning of each method. However, it does not perform fine-grain trace coverage at the instruction level.
- JVM class loader: It is very accurate since the JVM needs to load a class before executing it, by design. However, it limited to classes and does not trace methods.
A general scheme of JDBL is presented in the following figure:
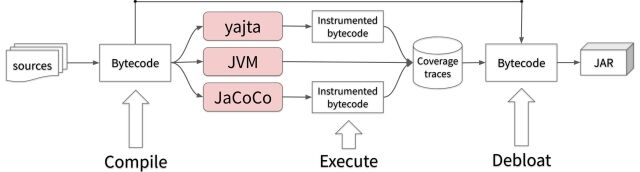
JDBL can be used to perform test-based debloat. The approach has five phases:
- Compiling a Java project
- Instrument the bytecode with the different coverage tools
- Execute the instrumented bytecode
- Debloat the parts of the code that were not covered by any coverage tool
- Package the debloated binaries into a JAR file for deployment.
As we observe, JDBL combines a variety of different implementations in order to achieve a unique goal: collecting the minimum set of classes and methods that are necessary to execute an application for a given workload. JDBL is extensible because it is not limited to a single coverage tool. It leverages the power of software diversity to break the limitations of existing tools and provide better debloat results.
The Lesson to Learn
Coverage tools implement different policies to handle the variety of bytecode constructs, thus posing a challenge for its usage on debloating. I have shown that, as in this case, when facing a hard problem for which no tool can provide a 100% accurate solution, combining the diversity of implementations of similar tools is a feasible approach to achieving better results. Of course, one can argue that this decision may hurt performance, but sometimes performance is not exactly of principal goal ![]()